How PMBus telemetry enables predictive maintenance
Introduction
The Power Management Bus (PMBus) is a familiar technology, defining a specification for digital monitoring and control of power supplies and systems. Based on an open standard protocol, it is flexible and fully featured and enables communications between a huge range of devices.
However, PMBus compliance does not guarantee reliability of a power device or system.
Instead, it’s up to the design engineer to understand the capabilities of PMBus, and to enable their power supply device or system to act on the data it can provide.
PMBus is a standard communication format, and there are industry committees working on this and other standardizations related to power applications. But there are many undefined areas where the standard does not cover new applications and use cases. This means that engineers must possess suitable design experience, an understanding of the system functionalities, and the ability to undertake structured implementation and testing.
In this blog, we’ll explain how PMBus can be used as a sensor network for predictive maintenance, thus improving reliability, and reducing RMAs and unplanned downtime. We’ll also look at how Flex Power Designer makes it straightforward to set up and manage.
What PMBus defines and what it doesn’t
PMBus is based on the I²C and SMBus protocols. It defines two distinct areas:
- The physical and electrical implementation of the communication links
- A standard set of commands that can be used to communicate
Beyond this, PMBus does not specify the power system architecture, form factor, or components used. The bus operates at a maximum speed of 1 MHz but does not specify the sampling rate for data acquisition.
There are many standard commands, including reading telemetry data such as output voltage and current (READ_VOUT, READ_IOUT) and temperature (READ_TEMPERATURE_1). The standard command set also includes commands for controlling a device, such as remote shut down and startup. Vendors can customize these commands and define their own.
Acquiring trustworthy data
Designers need to consider that PMBus data integrity relies on transmitting packets of TTL signals, so high levels of noise can corrupt the data. To ensure integrity, PMBus supports packet error checking (PEC).
As well as using PEC, PMBus systems should also validate addresses, and watch the SMBALERT # signal, which enables target devices to notify the controller of a fault condition. The system should be able to handle clock stretching, where a target node is allowed to hold the clock low to give the target node more time to process data.
When acquiring data, the power system should use appropriate sampling rates. This could include fast (10–50 Hz) rates during transients and around events, with slow (0.1–1 Hz) rates for long-term drift.
Mapping telemetry to real failure modes
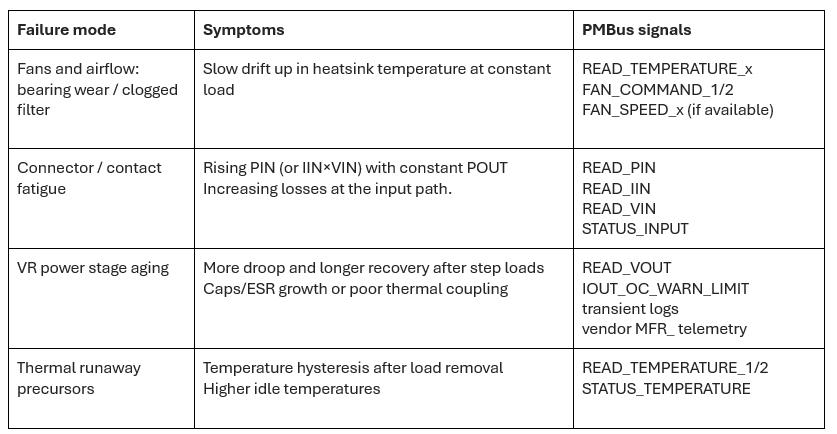
PMBus can provide many sorts of useful data, but we need to understand exactly which PMBus values indicate which degradations in a power supply.
The table below shows four of the most important failure modes in power supplies, and the symptoms that can be used to identify them. Then, the table lists exactly which PMBus signals can be monitored to find out if any of these symptoms are occurring – thus providing early warning of likely problems and enabling preventative maintenance.
To make best use of the data captured and to reliably detect anomalies, designers can use a rolling baseline. This involves calculating an Exponentially Weighted Moving Average (EWMA) and variance (EWVAR) per signal, normalized by ambient temperature where possible.
The designer can define suitable soft and hard limits, and the resulting actions. For example, a minor change in EWMA might simply create a service ticket or alert, while a more serious change could trigger an immediate shutdown. Context awareness is required, so the system doesn’t raise unnecessary alarms during known events such as a planned fan curve change.
Automatic mitigation before failure
Once an anomaly has been identified, this needs to be translated into actions over PMBus. For example:
- If the thermal margin is low, the system can increase phase-spreading on paralleled rails (vendor MFR_PHASE) and temporarily reduce the maximum load (IOUT_OC_WARN_LIMIT or power cap).
- If connector loss is rising, the system can adjust sequencing to lower simultaneous inrush, by staggering rails using TON_DELAY/TOFF_DELAY. It can also trigger a maintenance window while keeping the system up.
- If instability is suspected, the system can nudge compensation parameters if supported (vendor MFR_COMP_*), test in a controlled window, then store to non-volatile memory (NVM).
Flex Power Designer makes it simpler
To make system configuration and optimization as simple as possible, Flex Power Modules provides a free software tool: Flex Power Designer. This tool is not limited to just Flex Power Modules products, it supports generic products so that it can be used in virtually any system.
For a PMBus system, the tasks supported by Flex Power Designer could include:
- Setup: connect via a PMBus/USB bridge, discover devices, assign PAGEs and names
- Monitor: watch live V/I/T, log CSV, overlay rails, annotate events
- Simulate: transient loads and loop response, estimate phase margin before changing hardware
- Sequence and track: visually set TON_RISE, TOFF_DELAY, tracking, export golden config.
- Automate: scriptable workflows to apply soft limits, export logs to CMDB/ticketing
For validation and deployment, Flex Power Designer enables bench tests, A/B comparisons, and production hardening.
Conclusions
PMBus can prove invaluable as a predictive platform, providing actionable data that enables preventative maintenance and improves reliability.
To find out more, and for a free trial of Flex Power Designer, visit flexpowermodules.com.