Thermal system design boosted by enhanced tools
In datacom and telecom applications, there’s an ever-growing need for more power. In particular, data centers, cloud, and 5G applications are upping their requirements on power modules, which must also often fit in smaller spaces.
Of course, more power means more heat.
For design engineers, this means that they need to focus on thermal management more than ever before and get a more detailed understanding of their systems’ thermal performance. To keep power modules from over-heating, they may need more complex thermal management mechanisms such as liquid cooling and heat pipes instead of just relying on blowing cool air past the modules with a fan.
At Flex Power Modules, this means we are getting more requests to provide ever more sophisticated tools to help our customers to model the thermal performance of individual components, not just the complete system.
Importance of derating curves
Derating curves are a popular metric used by our customers. After all, the ability of converters to deliver power is restricted by their maximum operating temperature, and the output power that can be reached within that limit depends on the ambient air and system temperature, as well as the airflow.
To determine these limits, engineers have traditionally relied on derating curves, which plot the power output that can be achieved at any given ambient air temperature, without exceeding the maximum allowable operating temperature. Typical graphs show multiple curves, indicating how airflow at different speeds affects the derating (as shown below).
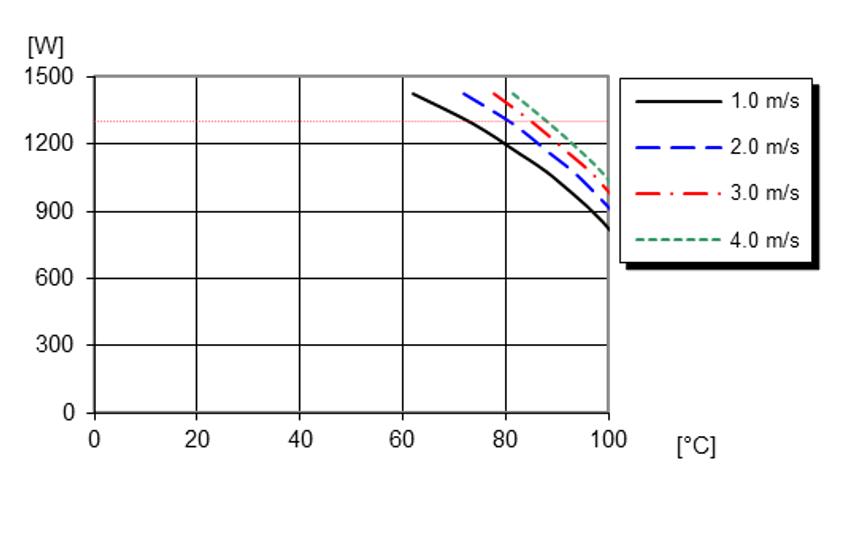
These derating graphs can be handy, and make it easy to compare different systems.
Nonetheless, the standard derating curve can be improved and we started to include the capability for our customers to use Flex Power Designer to graphically view the power dissipation and the efficiency characteristics of a particular module as a function of its input voltage, output voltage, output current, or temperature. This is a particularly useful set of metrics for high power modules, and the FPD tool delivers excellent flexibility for customers to evaluated advanced thermal measurement when it is required.
The derating curve is based on an analysis of ambient temperature. It does not show the behaviour of individual parts, such as the DC/DC converter or heatsink, and this means that it does not indicate how the modules’ performance is affected by the test rig being used.
New graphs show more data
To overcome these limitations, Flex Power Modules has developed a new approach, which shows thermal performance on three-axis derating graphs, as shown below. We’re starting to use this kind of graph on the datasheets for new products, so it’s easy to get more detail on a device’s thermal performance. Once again, this is especially useful analysis for advanced thermal management of high power devices.
To create the graph, we evaluate the converter’s behaviour at a set of pre-determined test points, varying ambient pin temperature (shown on the X axis) and baseplate temperature (shown on the Z axis). For each of these test points, we adjust the load until a temperature sensor on the converter reaches its maximum allowed reading – then, when stable, this tells us how much output power the converter can provide in these conditions.
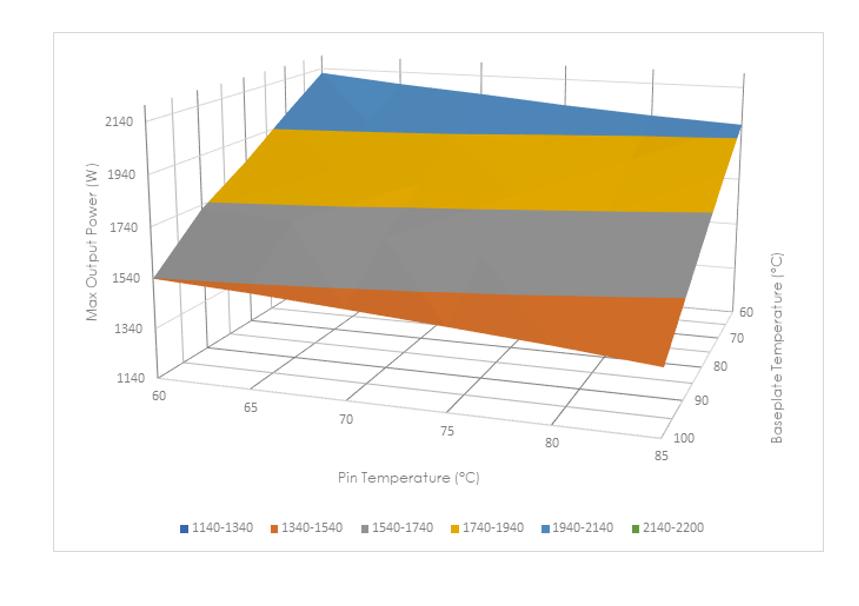
Once these points are plotted, we get a 3-axis graph, as shown. The colored bands on the graph show ranges of output power, as specified in the key at the foot of the graph.
These new 3-axis graphs mean that engineers can look at the performance of their system in more detail, and can model the behavior of individual components to find out the maximum power they can deliver in a given set of operating conditions to allow even greater depth of heatsink analysis. For example, if a designer knows that the pin temperature in their system won’t go above 80ºC and the baseplate worst-case temperature is 85ºC, they could use the graph above to read off the converter’s maximum output power from the Z axis.
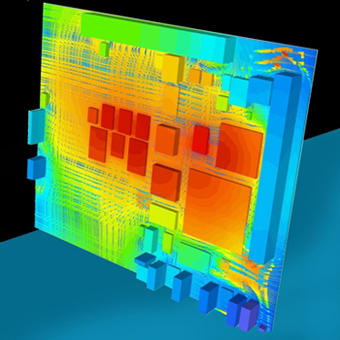
FloTHERM thermal simulation
The derating graphs are, of course, just another set of tools that engineers can apply to understand the thermal behavior of their system. In addition, we now provide thermal modeling capabilities for components within our Flex Power Designer software tool. We also provide detailed, editable thermal models for all our new products for use in Mentor’s FloTHERM software. By adding these models, our customers receive a more complete thermal solution and utilize accurate, fast and convenient thermal analysis.
View our recent webinar
Want to find out more about how Flex Power Modules can help you with your system cooling designs? On 18 March 2021, we held a webinar that provided an overview of thermal management design support we offer. It includes information on our new 3-axis thermal derating graphs, additional modeling information presented within our Flex Power Designer GUI, as well as information on the FloTHERM models we have to offer.
If you’re hungry for more insights, you can check out our Design Note on Thermal Characterization of Flex Power Modules.